EDA_Salary_Dataset
Salary Dataset - Exploratory Data Analysis (EDA)
Introduction
This project explores salary trends using Exploratory Data Analysis (EDA). The goal is to uncover insights into salary distributions, job roles, industries, and company factors that influence compensation. Through 19 high-quality visualizations, we analyze the relationship between job roles, employment status, company ratings, and salary trends.
📂 Dataset Overview
The dataset contains structured salary information across various job roles, employment types, industries, and locations. The analysis focuses on:
- Salary Distribution: Understanding how salaries are spread across different roles.
- Employment Status Impact: How full-time, part-time, and contract jobs affect salary levels.
- Industry Trends: Identifying the most lucrative industries.
- Job Role Analysis: Examining salary differences across roles.
- Company Ratings Influence: Analyzing the correlation between salary and company reputation.
📌 Libraries & Dependencies
To successfully run the project and generate the visualizations, ensure you have the following Python libraries installed:
pip install pandas matplotlib seaborn folium wordcloud numpy
📊 Exploratory Data Analysis
1️⃣ Salary Distribution – Histogram & KDE Plot
This visualization represents the overall salary distribution in the dataset, highlighting salary concentration and outliers.

2️⃣ Salary Density Plot
A Kernel Density Estimate (KDE) plot illustrating the probability density of different salary ranges.

3️⃣ Salary Distribution by Employment Status
Compares salaries based on employment type (Full-time, Part-time, Contract).

4️⃣ Salary Distribution Across Job Roles
Visualizes the variation in salaries across different job titles.

5️⃣ Most Popular Job Titles
Displays the most frequently occurring job titles in the dataset.

6️⃣ Most Common Job Roles
A bar chart showcasing the most common job roles in the dataset.

7️⃣ Top 10 Locations with Highest Salaries
Identifies the locations offering the highest average salaries.

8️⃣ Top Companies Paying the Highest Salaries
Highlights the companies offering the best compensation.

9️⃣ Salary Breakdown by Job Roles & Employment Status
Illustrates how different job roles and employment statuses impact salary ranges.

🔟 Salary Trends Over Job Roles
A trend analysis of how salaries fluctuate across various job positions over time.

1️⃣1️⃣ Salary Trends per Industry
Examines how different industries pay over time.

1️⃣2️⃣ Salary Variance by Employment Type
Shows how salary varies across different employment types.

1️⃣3️⃣ Salary Variance by Job Roles & Employment Status
Explores the variance in salaries when considering both job roles and employment status.

1️⃣4️⃣ Salary vs. Company Rating
Analyzes whether higher-rated companies offer better salaries.

1️⃣5️⃣ Salary Outlier Analysis
Detects anomalies in salary distribution, identifying potential data issues or extreme values.

1️⃣6️⃣ Salary Trends Per Job Role & Employment Type
Visualizes how salary trends shift based on job role and employment type.

1️⃣7️⃣ Correlation Heatmap of Salary Dataset
A correlation matrix heatmap showcasing relationships between salary and other features.

1️⃣8️⃣ Salary Distribution by Job Role
Examines the salary spread for different job roles.

1️⃣9️⃣ Top Job Roles Salaries
Shows the highest-paying job roles in the dataset.

🔎 Key Insights
- Salaries significantly vary based on employment type, with full-time roles offering the highest pay.
- Top-paying companies have higher company ratings, indicating a correlation between job satisfaction and salary.
- The technology and finance sectors offer the most competitive salaries.
- Salary outliers exist, highlighting potential highly paid executive roles or data inconsistencies.
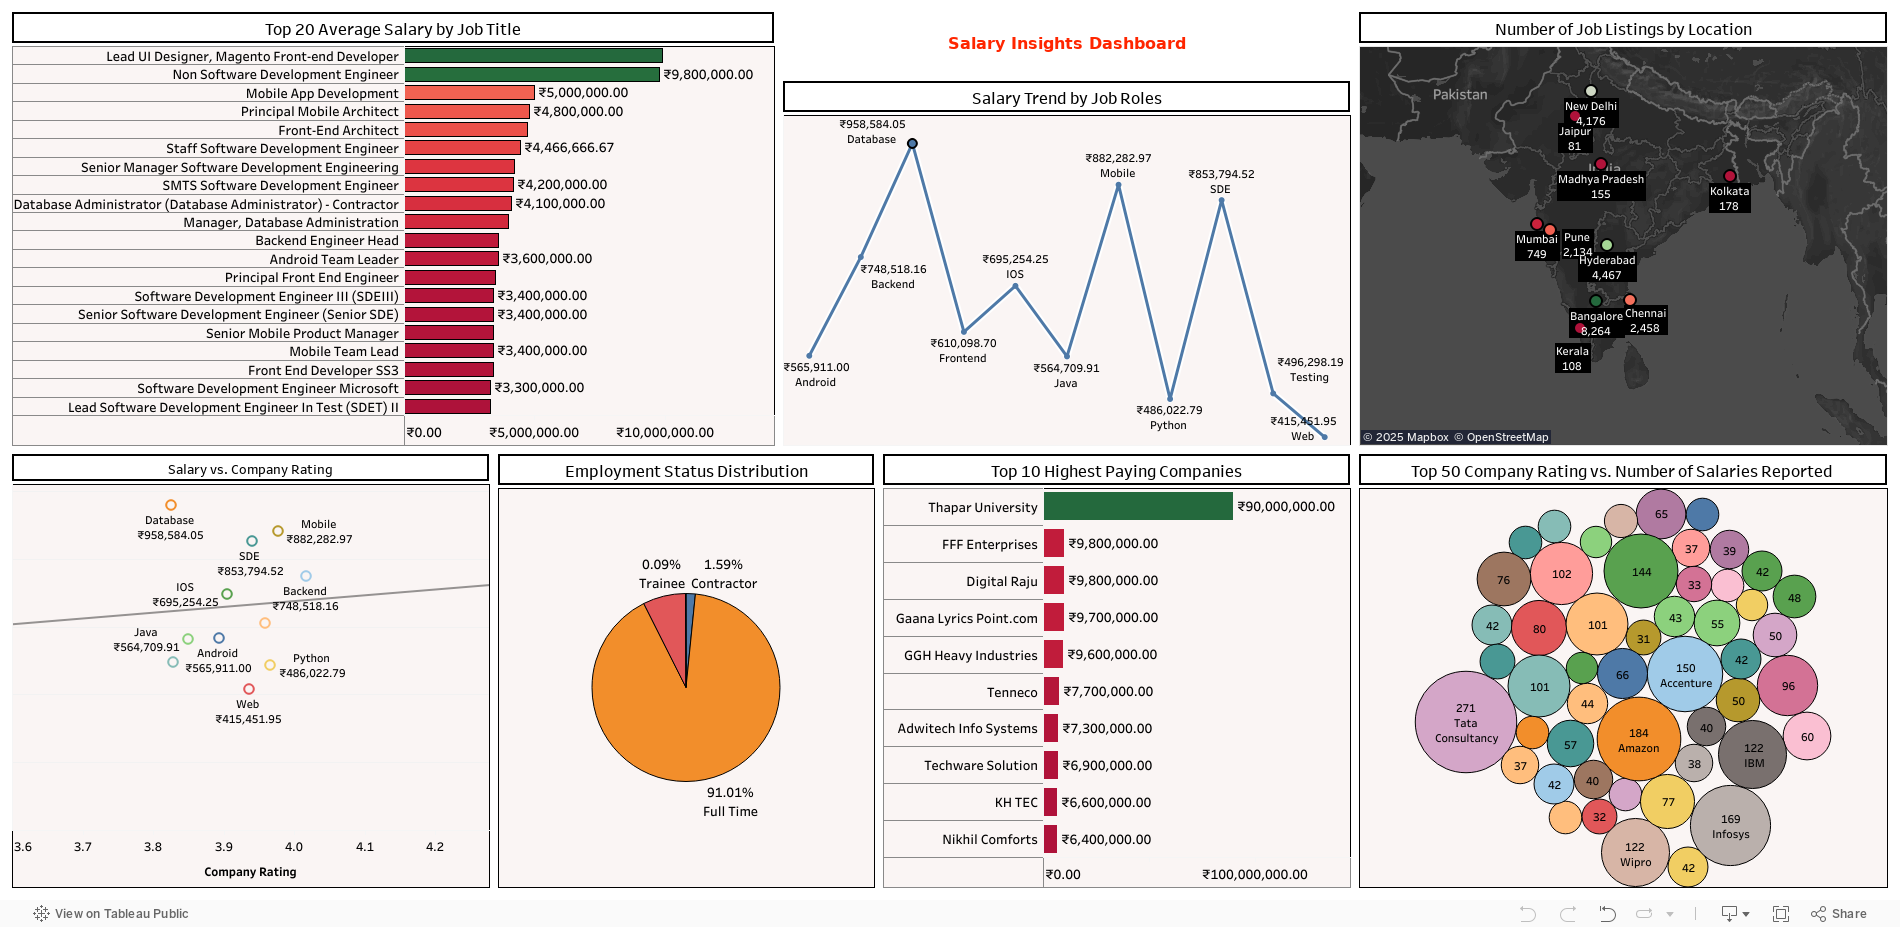
📊 Interactive Salary Insights Dashboard
Explore the interactive **Salary Insights Dashboard** created using **Tableau** to gain deeper insights into salary distributions, job roles, industries, and company factors influencing compensation.
🚀 Future Work
- Incorporating machine learning models to predict salary based on job factors.
- Adding interactive dashboards using Plotly or Tableau.
Author: Dhruv Trivedi