Electric-Vehicle-Analysis
🏎 Electric Vehicle Analysis: Dive Deep 🚀
Dive deep into the electrifying world of EVs. Explore the market, witness trends, and understand the intricacies of vehicle types, ranges, and year-wise evolutions.
📊 1. Market Overview
Venture into the heart of the EV market. Discover where most vehicles lie in terms of range and price. Understand the choices that manufacturers are making.
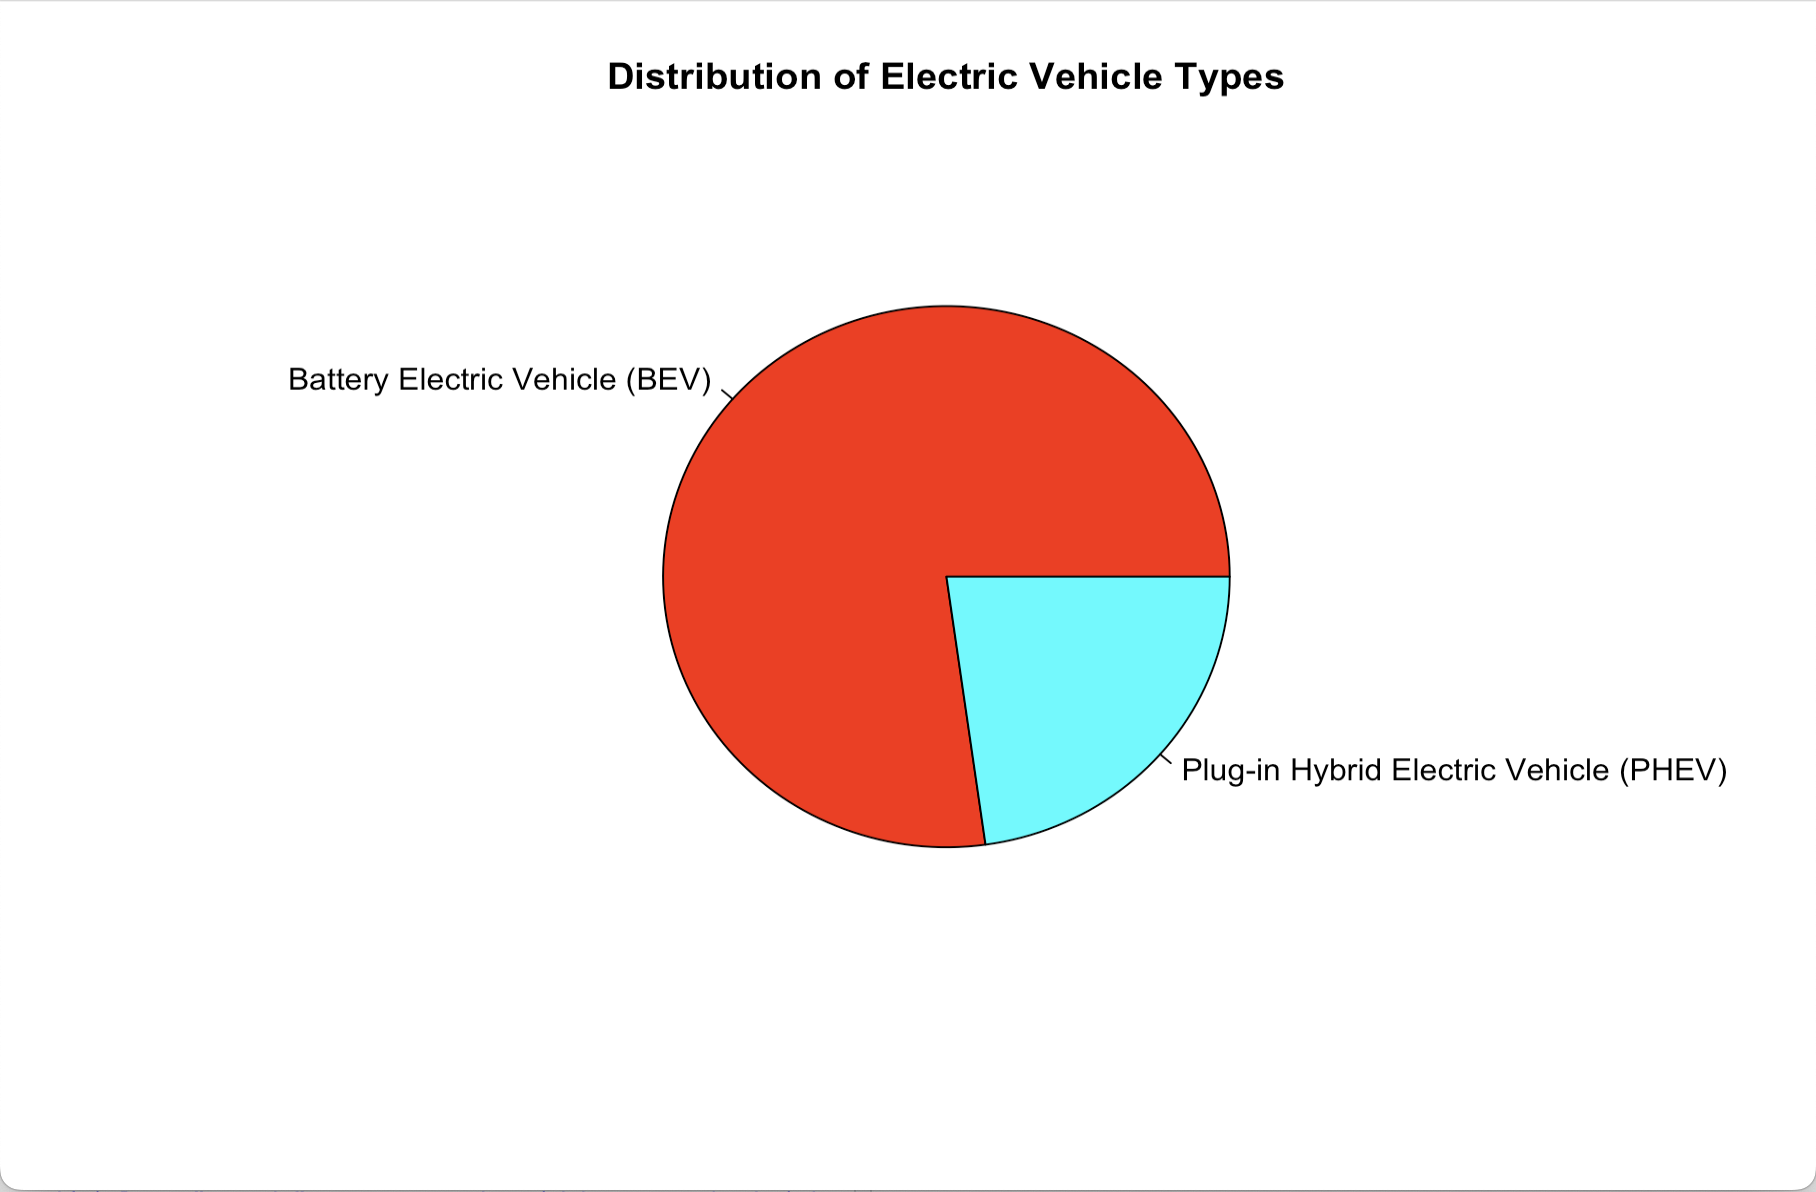
Distribution of Electric Vehicle Types
Market Share of EV Brands

🕝 2. Time Machine: The EV Evolution
Journey through time with histograms that unravel the story of EVs, from their humble beginnings to their recent surge.
Histogram Highlights:
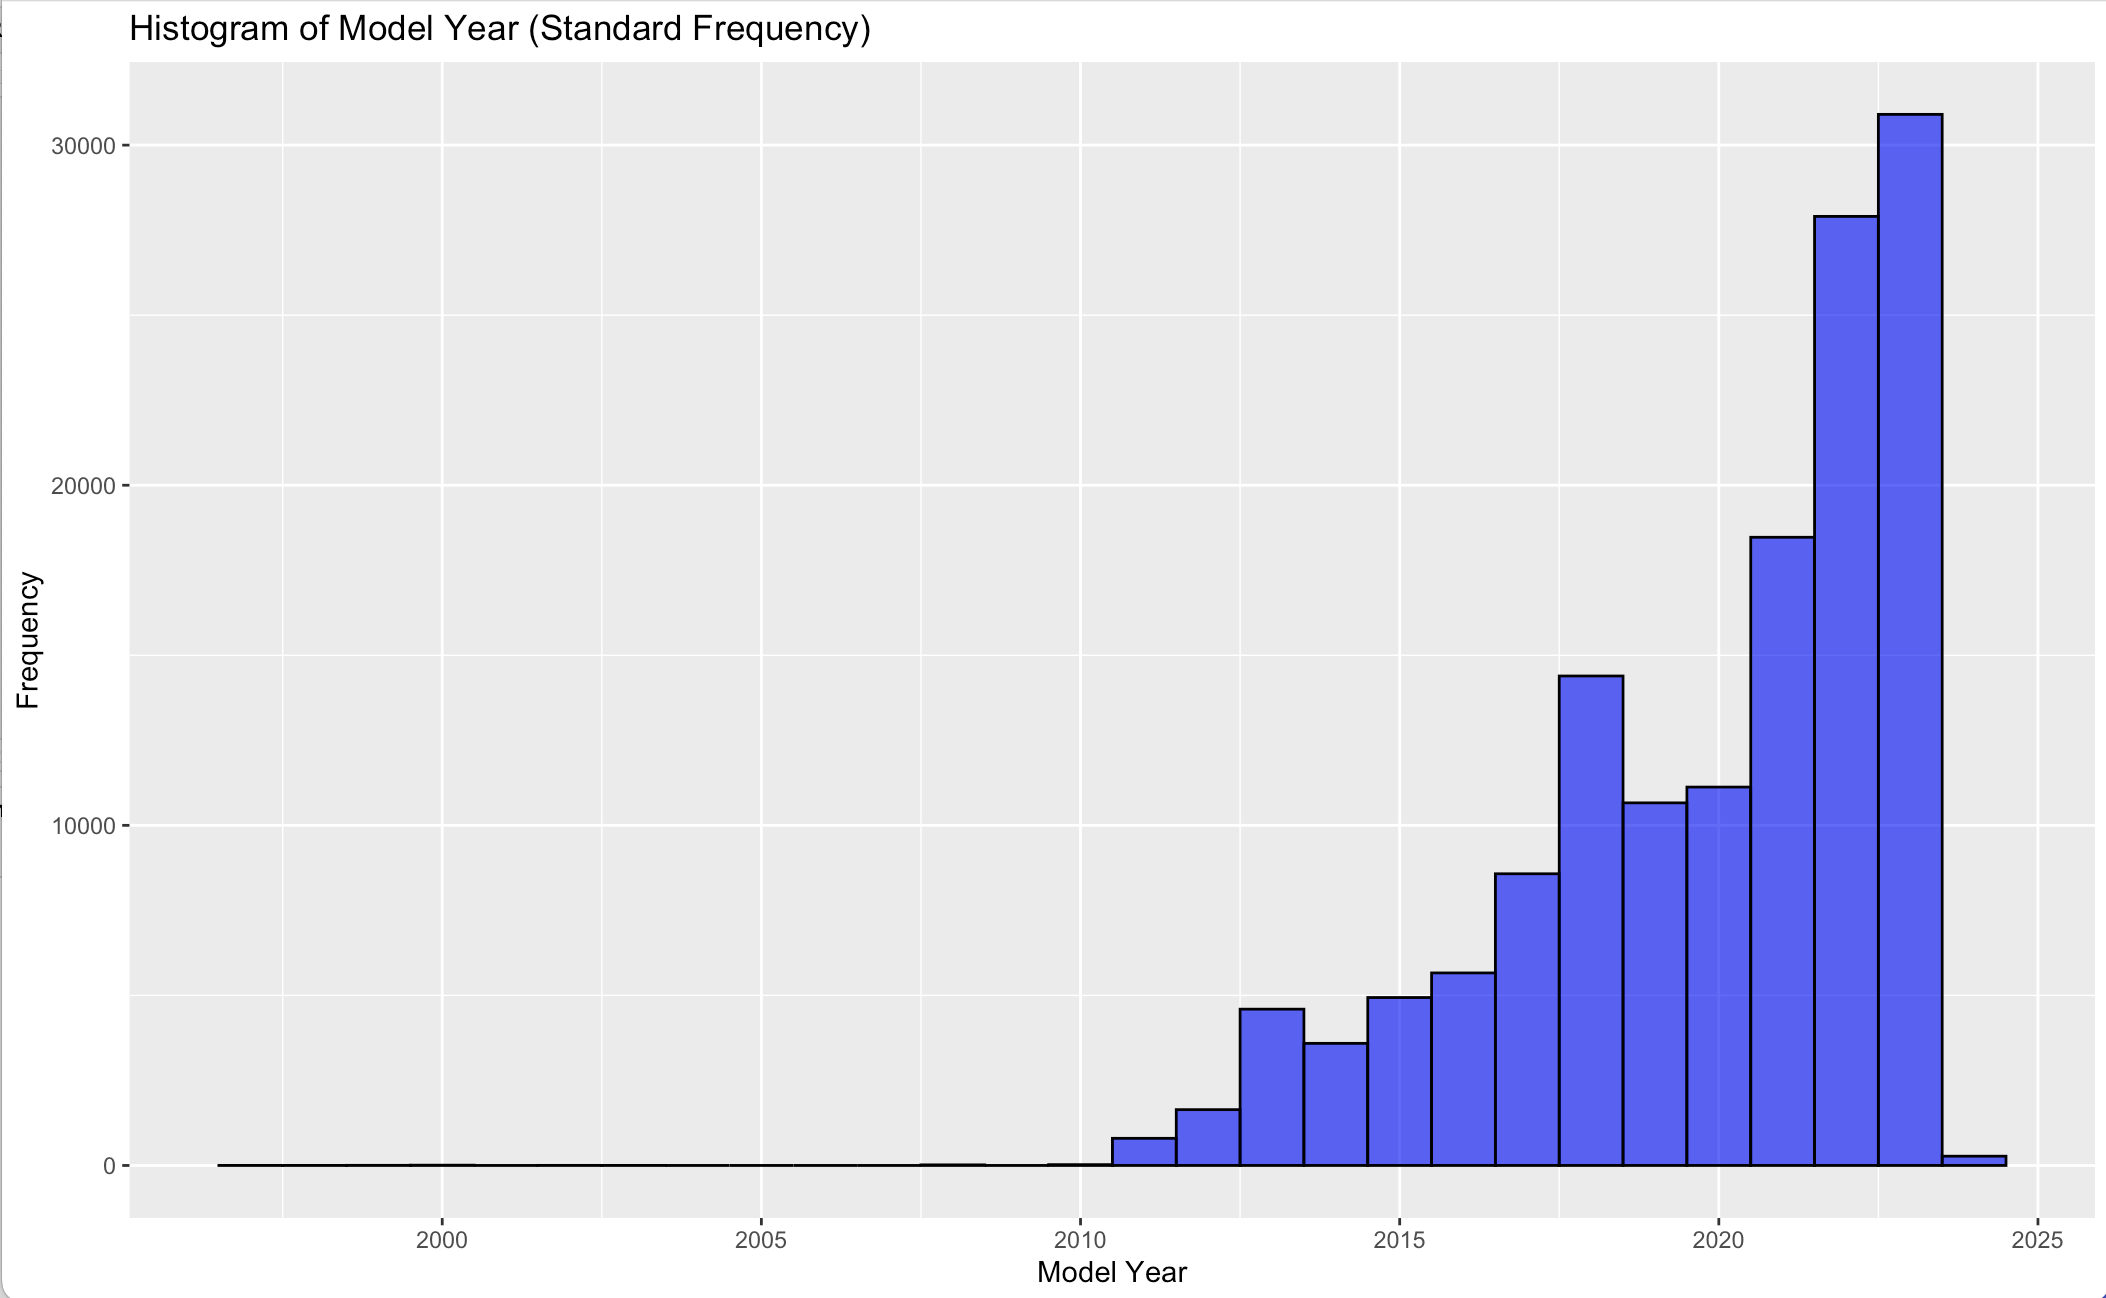
Model Year: A Standard Frequency Perspective
Model Year: A Dive into Relative Frequencies

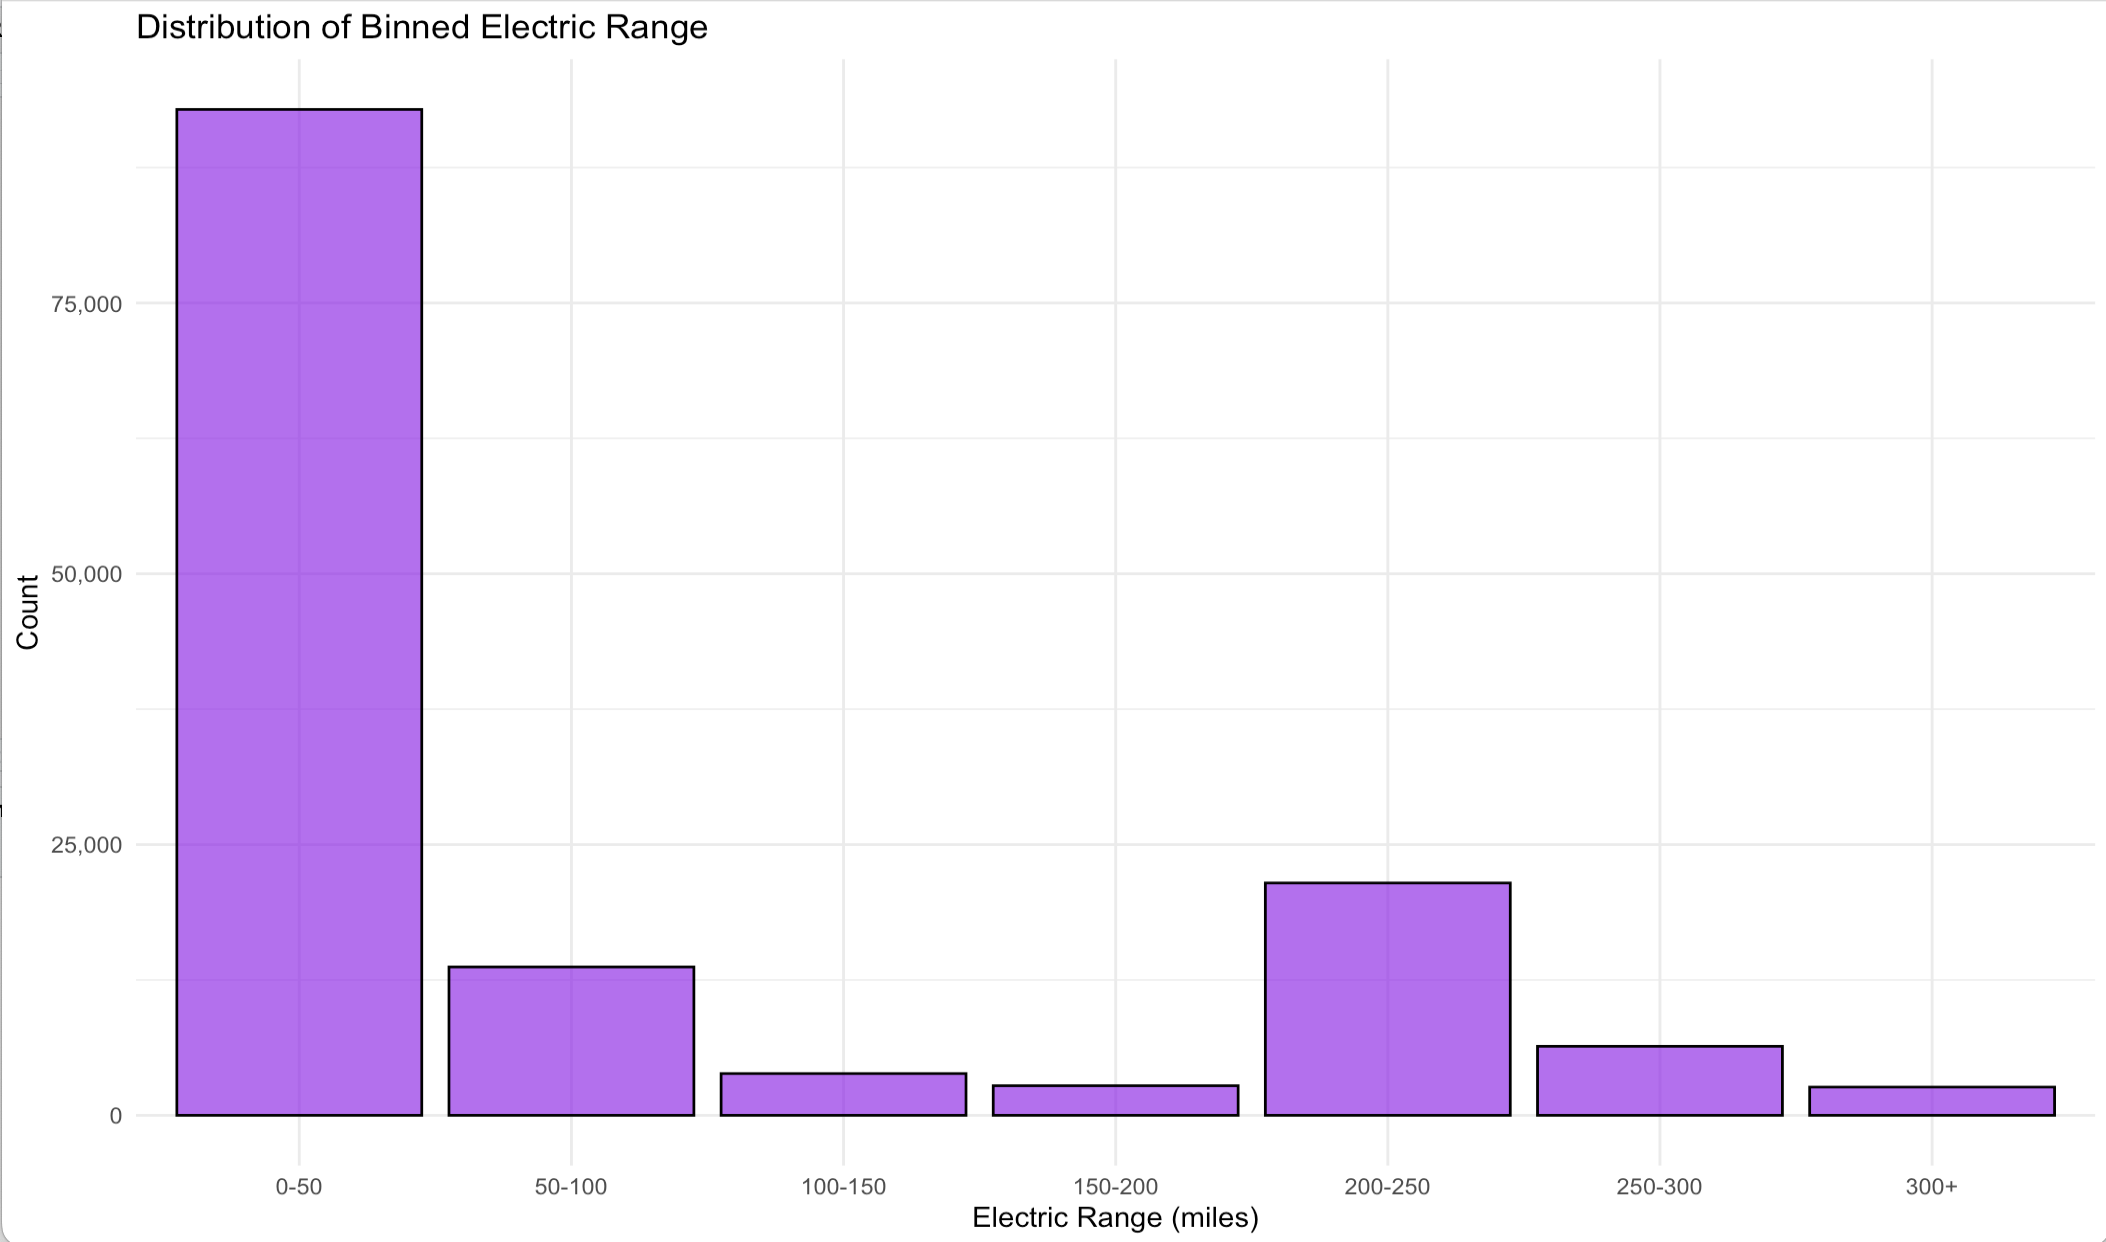
Electric Range vs. Count
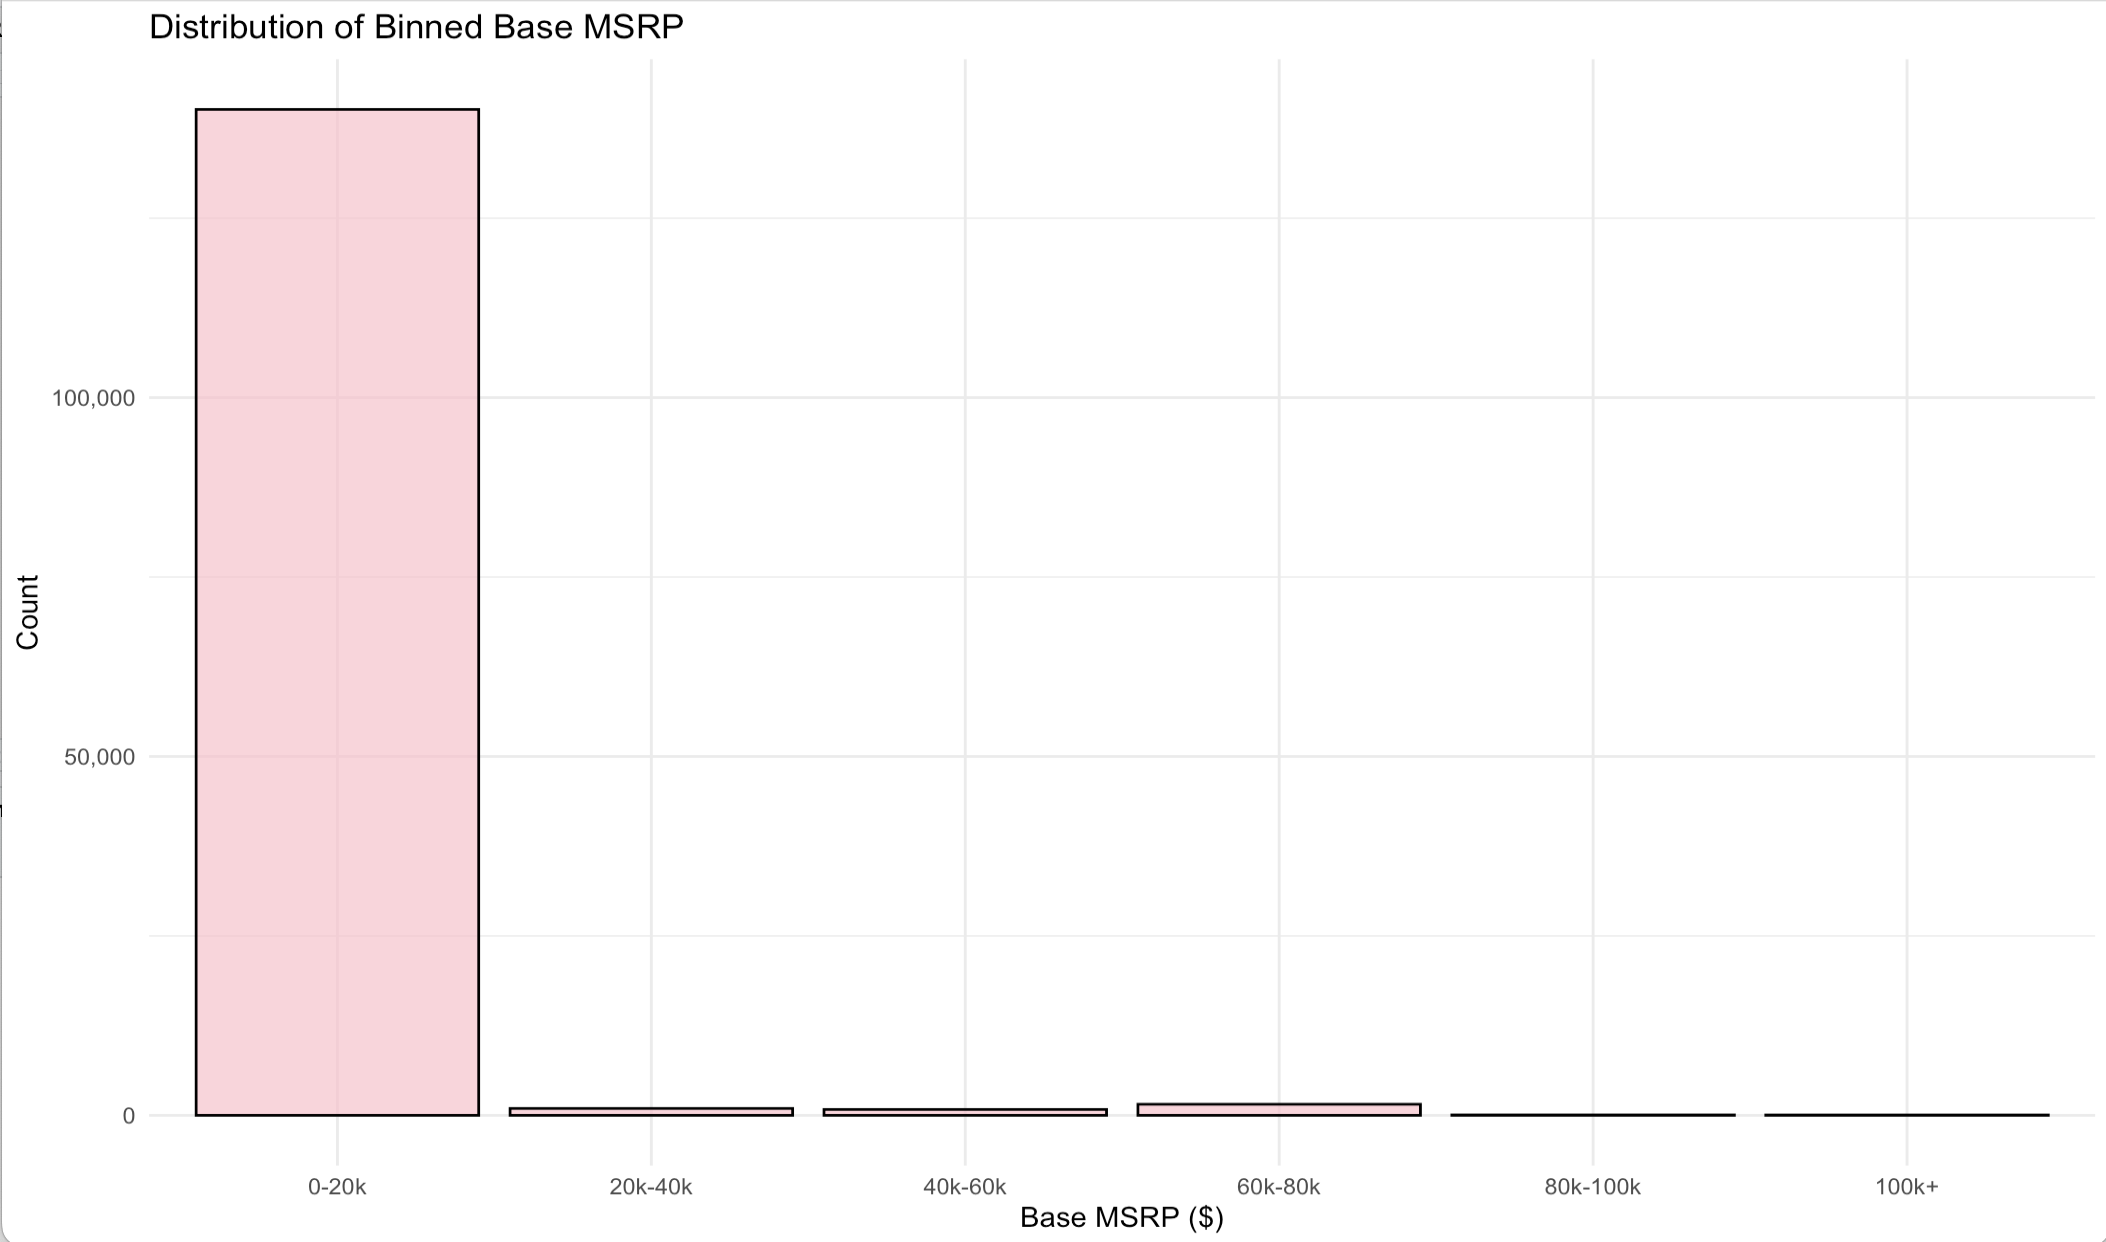
Base MSRP ($) vs. Count
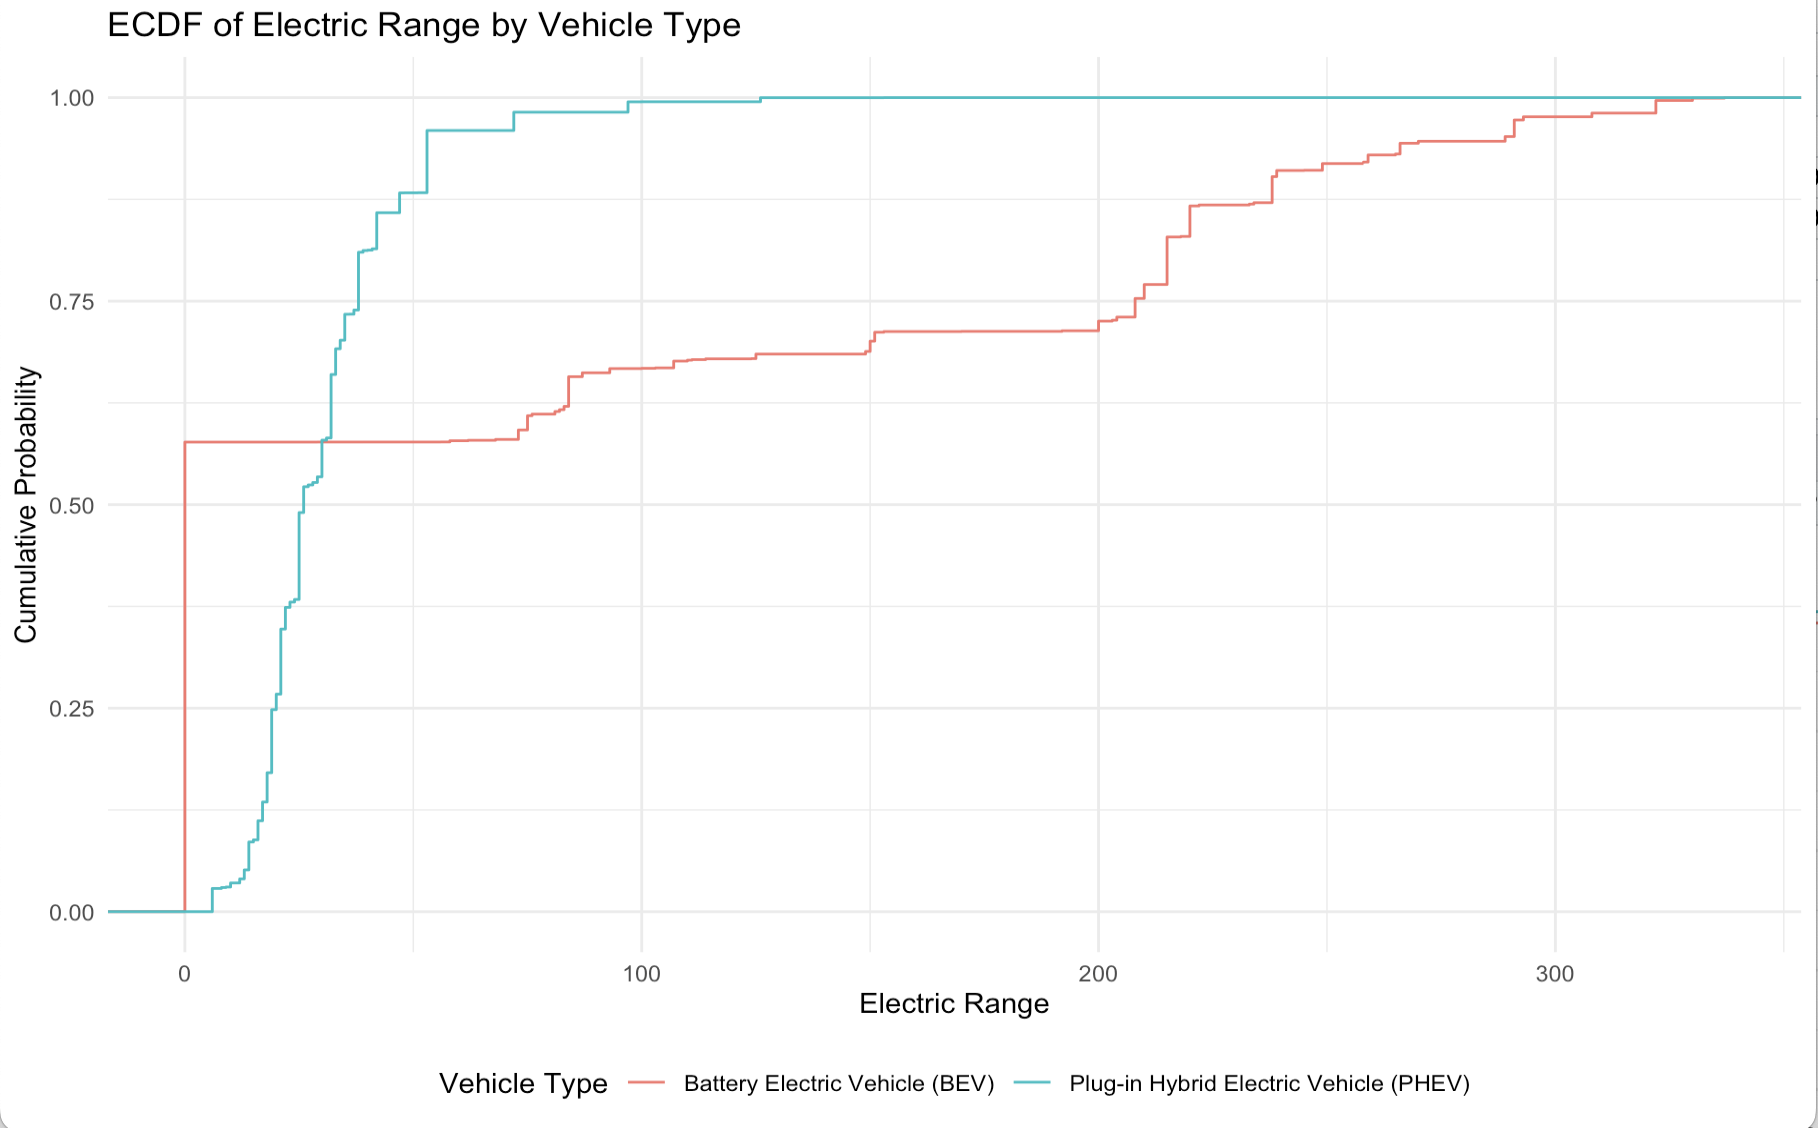
📈 3. ECDF: The Electric Range Spectrum
The ECDF plot is a window into the electric range distribution. Decode the nuances and understand where most vehicles stand.
ECDF of Electric Range by Vehicle Type
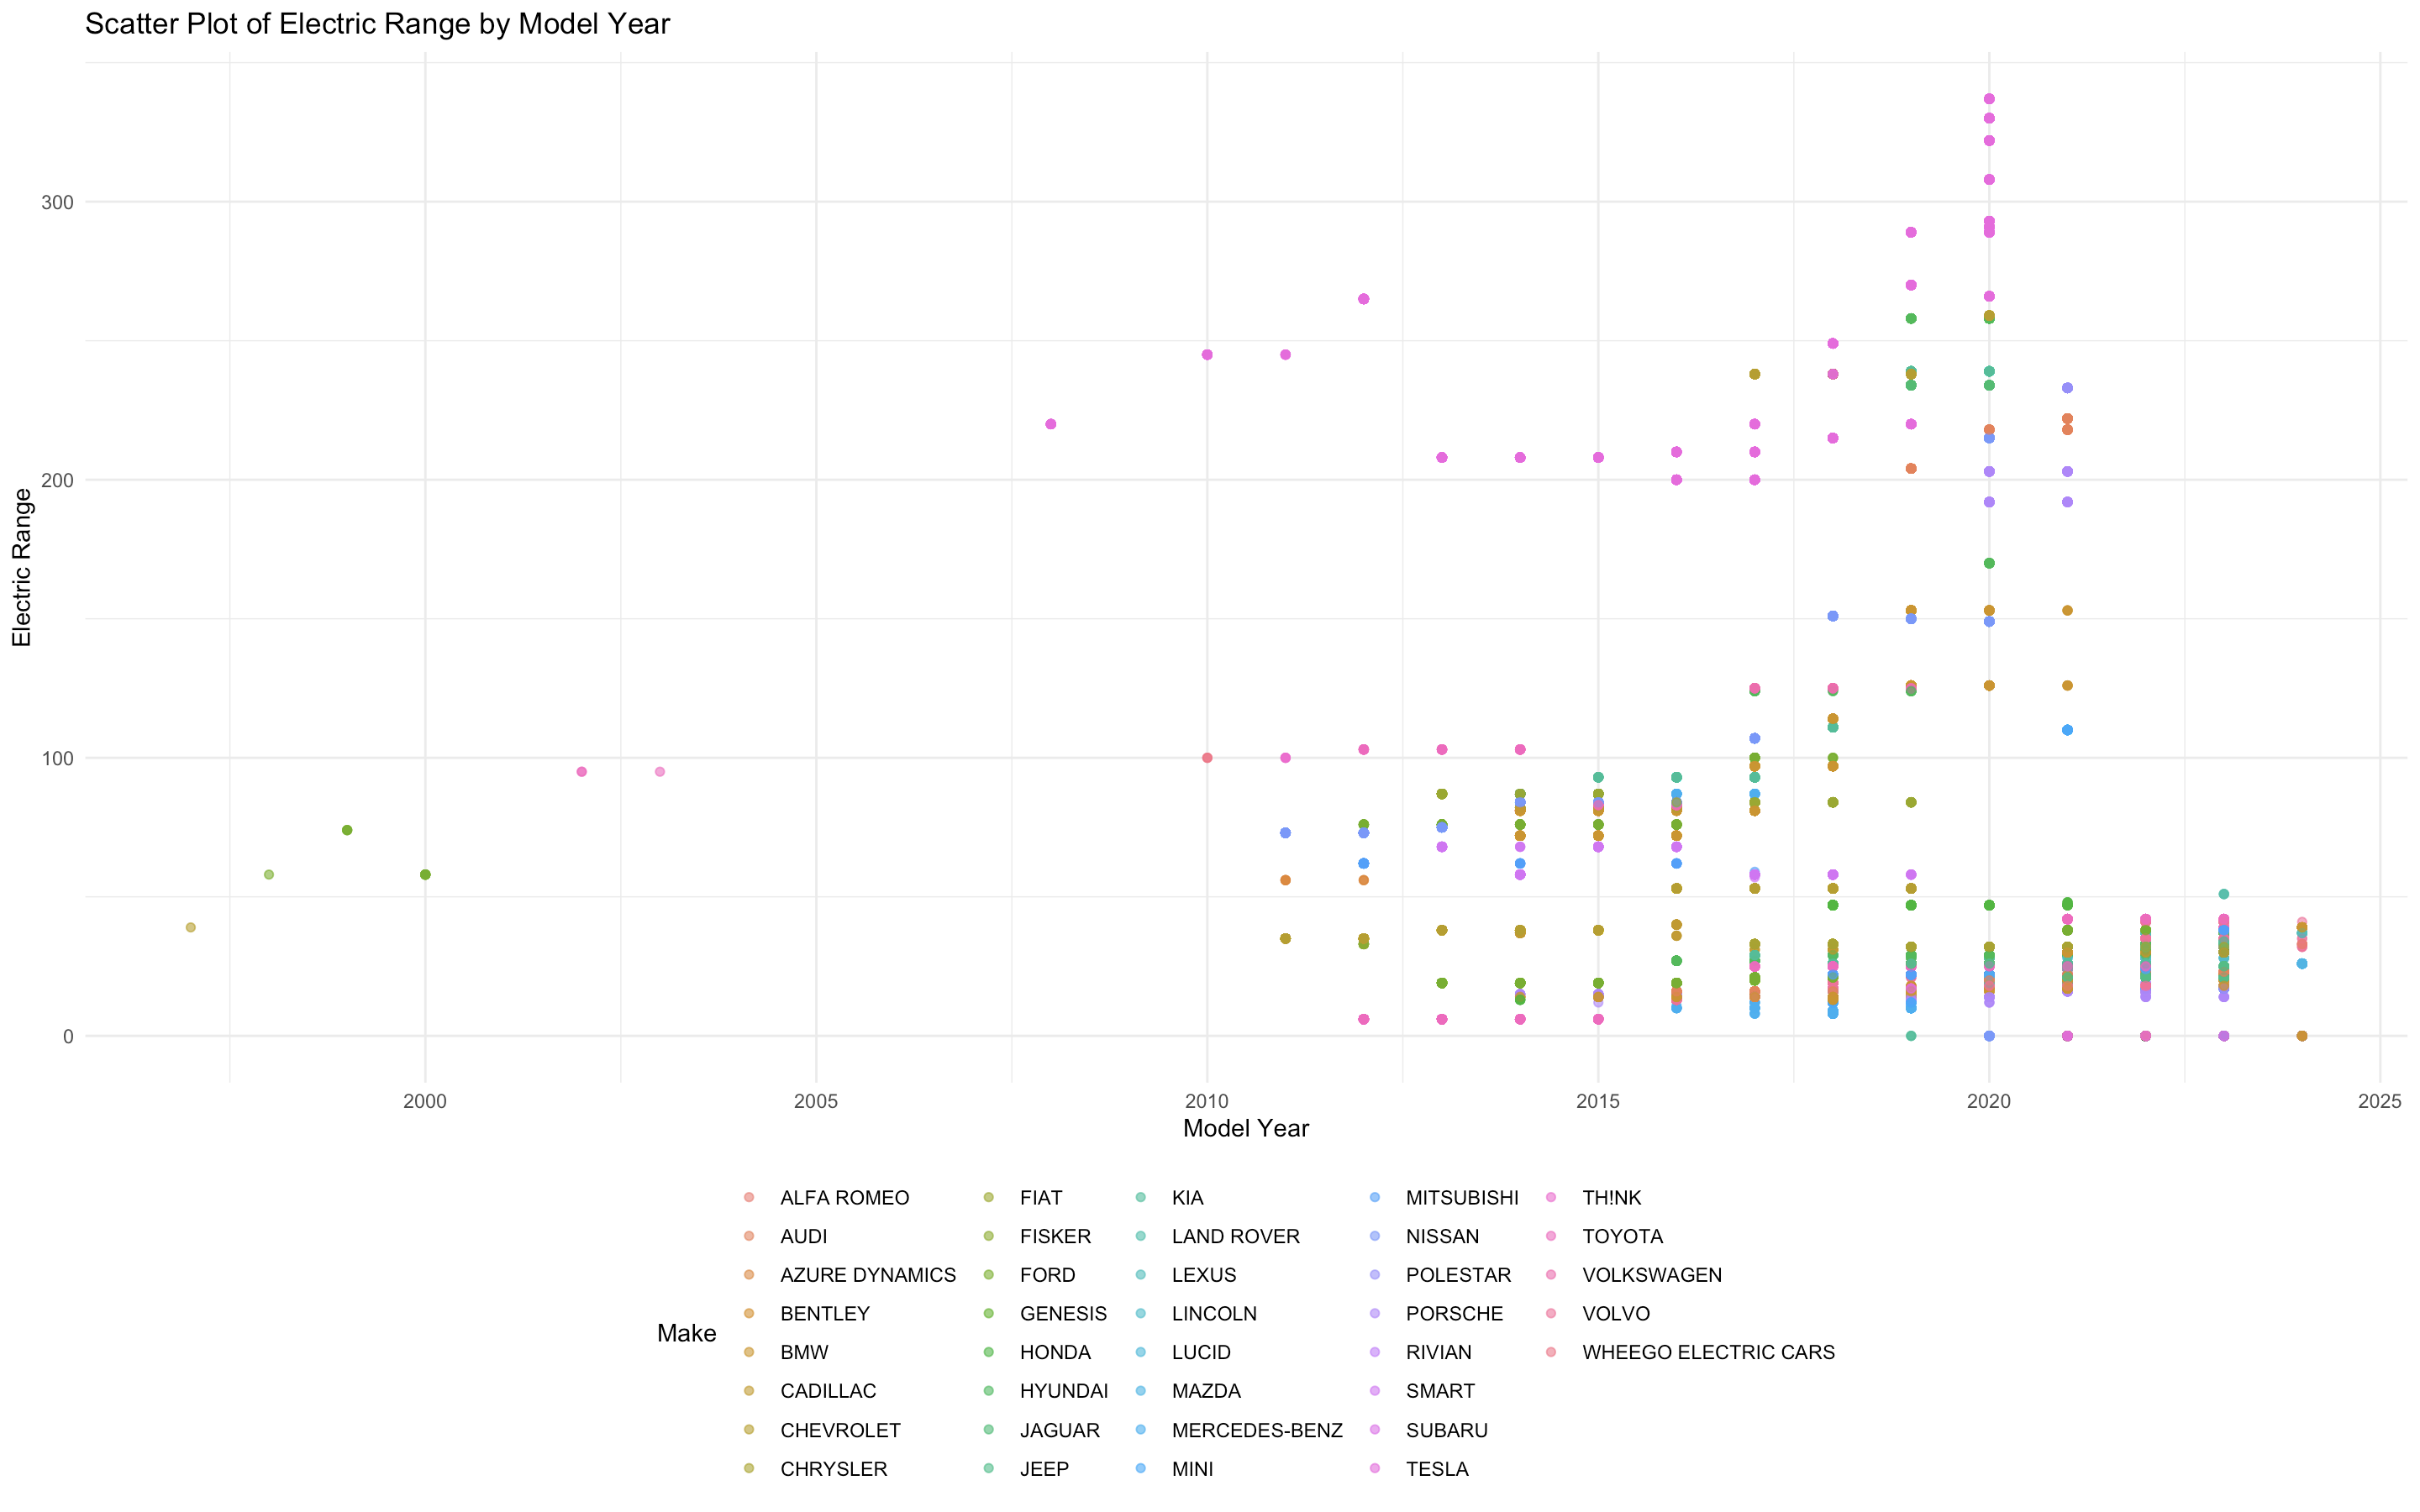
🌐 4. Insights by Segmentation
Dive into segmented visualizations that offer a kaleidoscope view into electric ranges, vehicle types, and more.
Scatter Plot: Exploring Variable Relationships
💡 Note: Deep insights await as you explore each visualization. They offer a snapshot of the dynamic landscape of the electric vehicle industry.