World-University-Rankings-2023-analysis
🌍 World University Rankings 2023
Data Analysis and Visualization 📊
📌 Introduction:
Dive deep into the “World University Rankings 2023” dataset. It’s a treasure trove of insights revealing the performance of universities on a global stage, spanning metrics from teaching prowess to research capabilities.
🔨 Data Cleaning:
Before the real action, we prepped our dataset:
- Numeric Makeover 🧬:
- Fields like
International Student,OverAll Score, andNo of studentshed their textual skins to emerge as pure numbers. - Stripped away pesky percentage signs and commas for a cleaner look!
- Fields like
- Dissecting Ratios 🔪:
- Sliced and diced the
Female:Male Ratioto extract individual gender counts. - Birthed a numeric ratio for a more analytical touch.
- Sliced and diced the
🎨 Visualizations and Deep Dives:
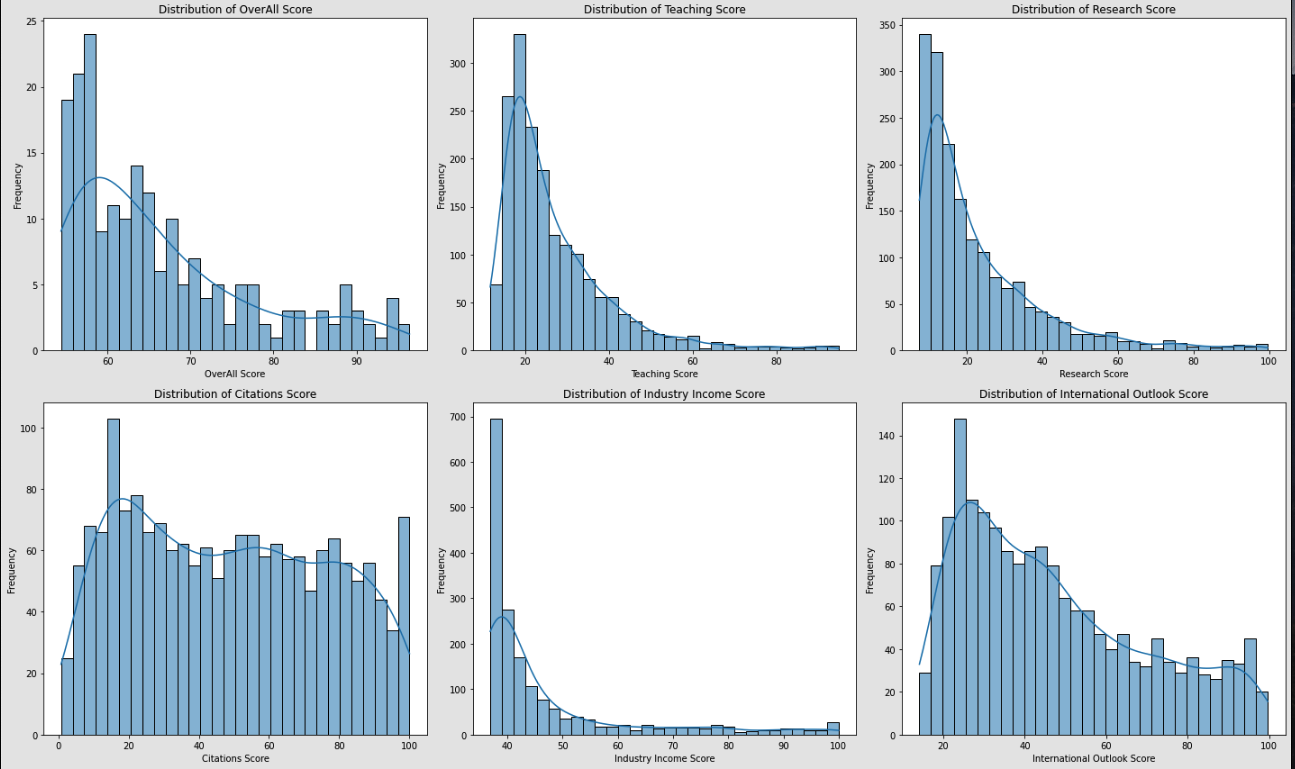
- Scoreboard Histograms 📊:
- Painted the landscape of scores:
OverAll Score,Teaching Score,Research Score,Citations Score,Industry Income Score, andInternational Outlook Score.
🔍 Insights:
- Score scarcity at the top! Few universities touch the zenith.
Teaching,Research, andCitationsdance in harmony with theOverAll Score.- The
Industry Income Score? Well, it marches to its own beat.
- Painted the landscape of scores:
- Country Count Barometer 🌏:
- Etched bars representing the top 30 countries, ranked by their university count.
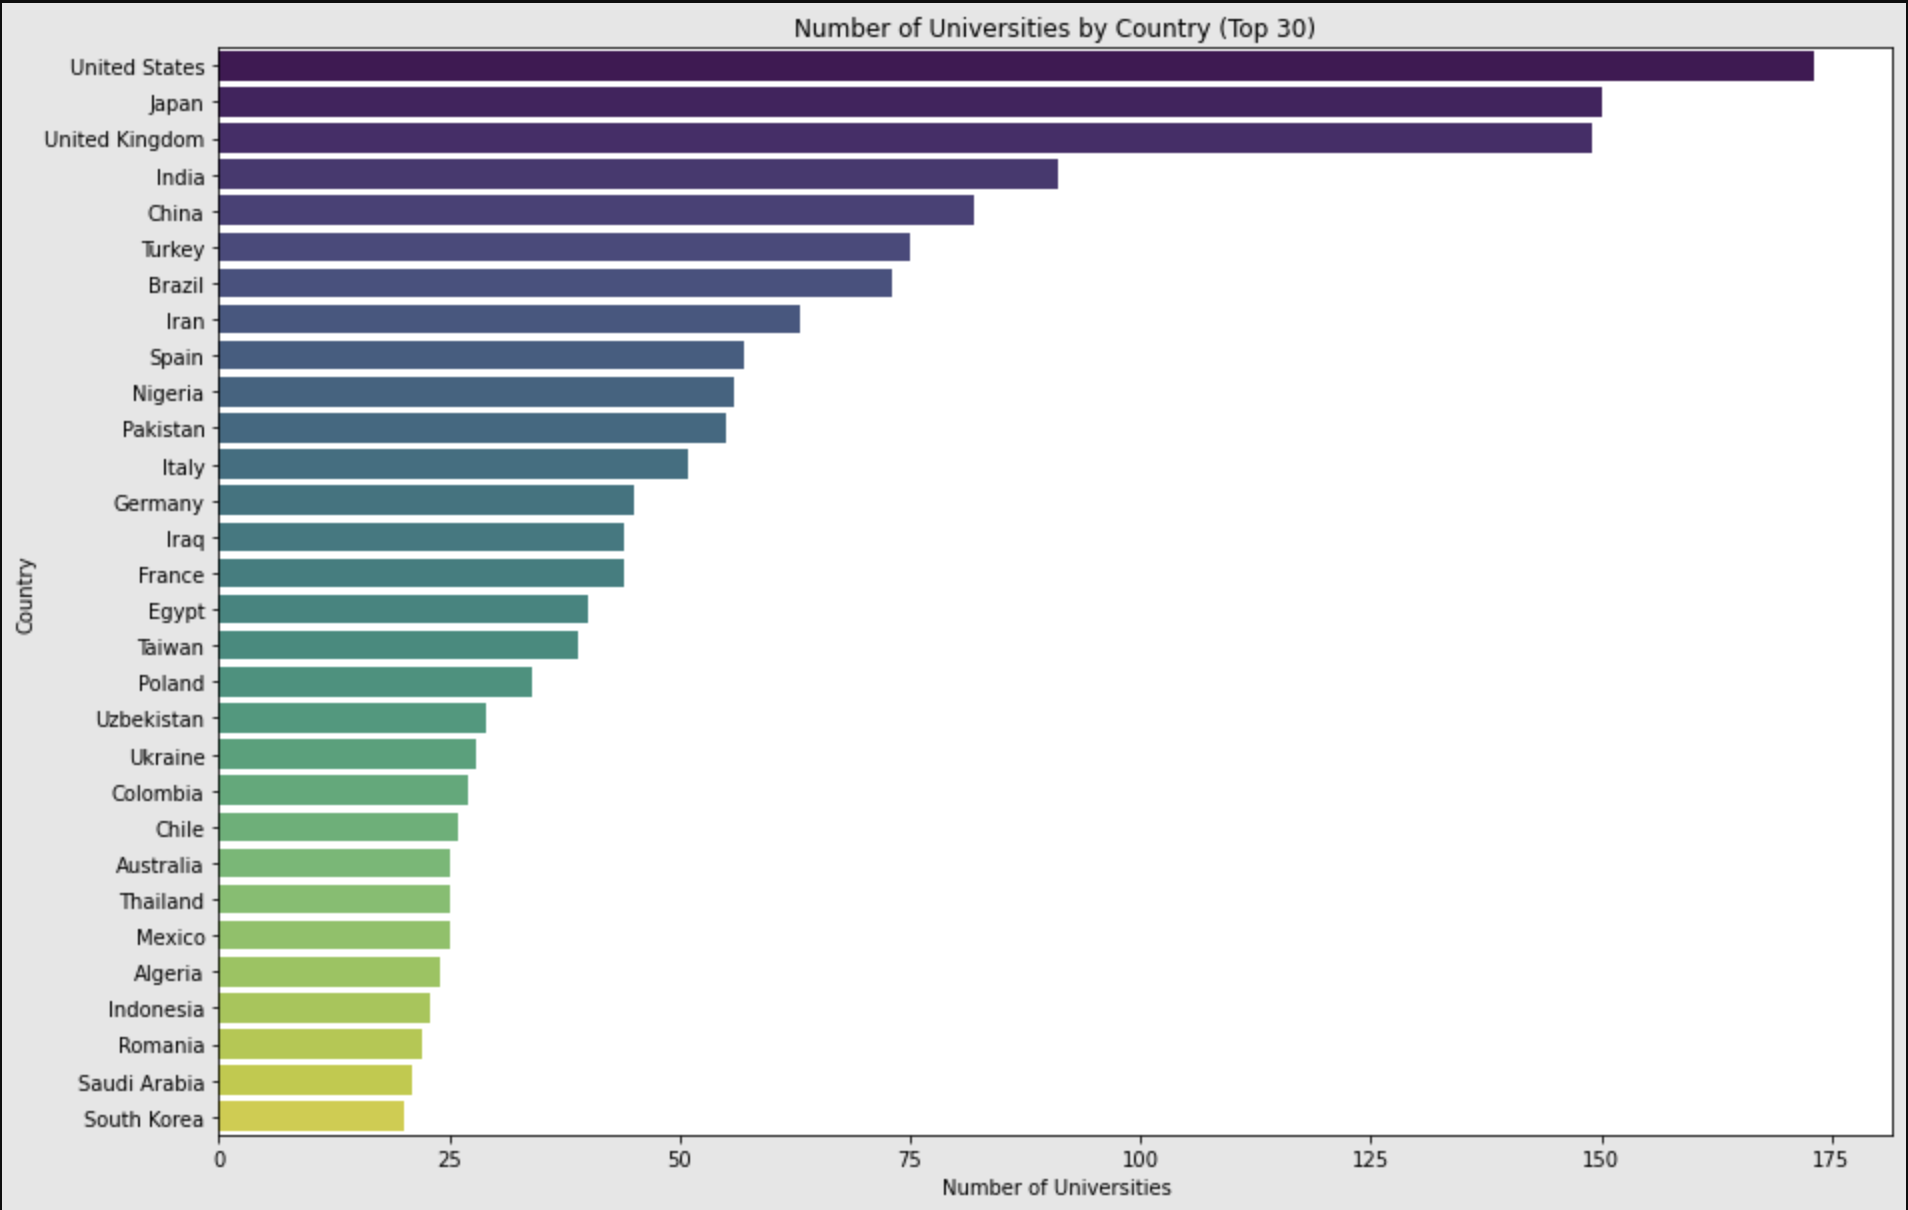
**🔍 Insights:**
- USA stands tall, with the UK, India, and China trailing behind. A testament to their colossal educational infrastructures.
- Gender Balance Pie 🚻:
- A pie sliced to represent the gender equilibrium across universities.
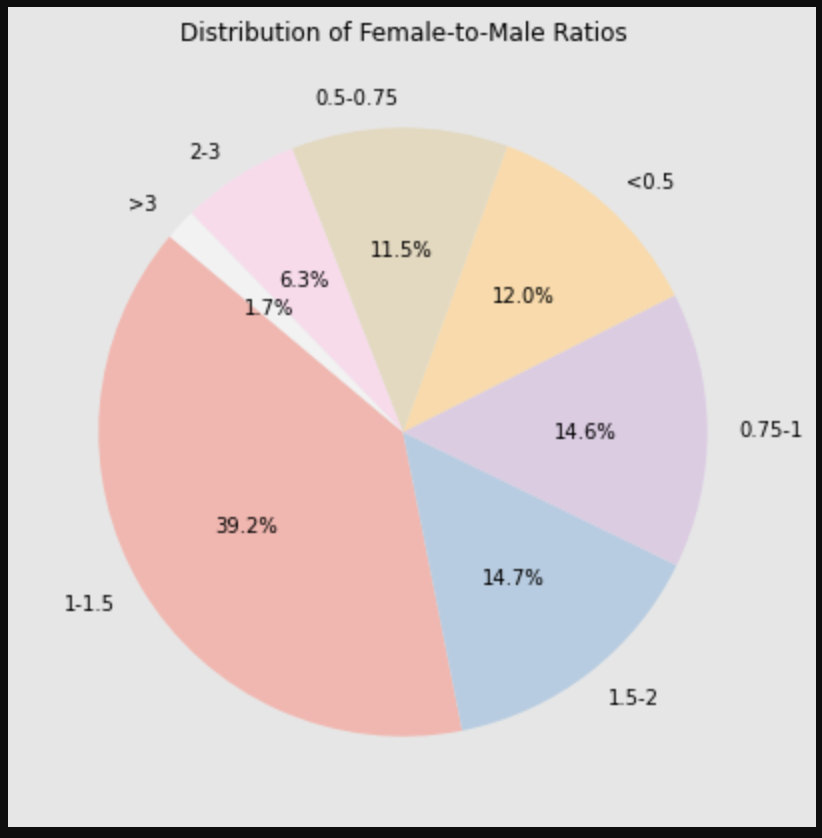
**🔍 Insights:**
- The scales balance out at many universities. Gender equality is in sight!
- The majority of universities have a balanced gender ratio (between 0.75-1 and 1-1.5), indicating roughly equal numbers of male and female students.
- Yet, several universities tip towards female domination (ratios greater than 1).
- Score Correlation Heatmap 🔥:
- A warm heatmap radiating the intricate relationships between performance metrics.
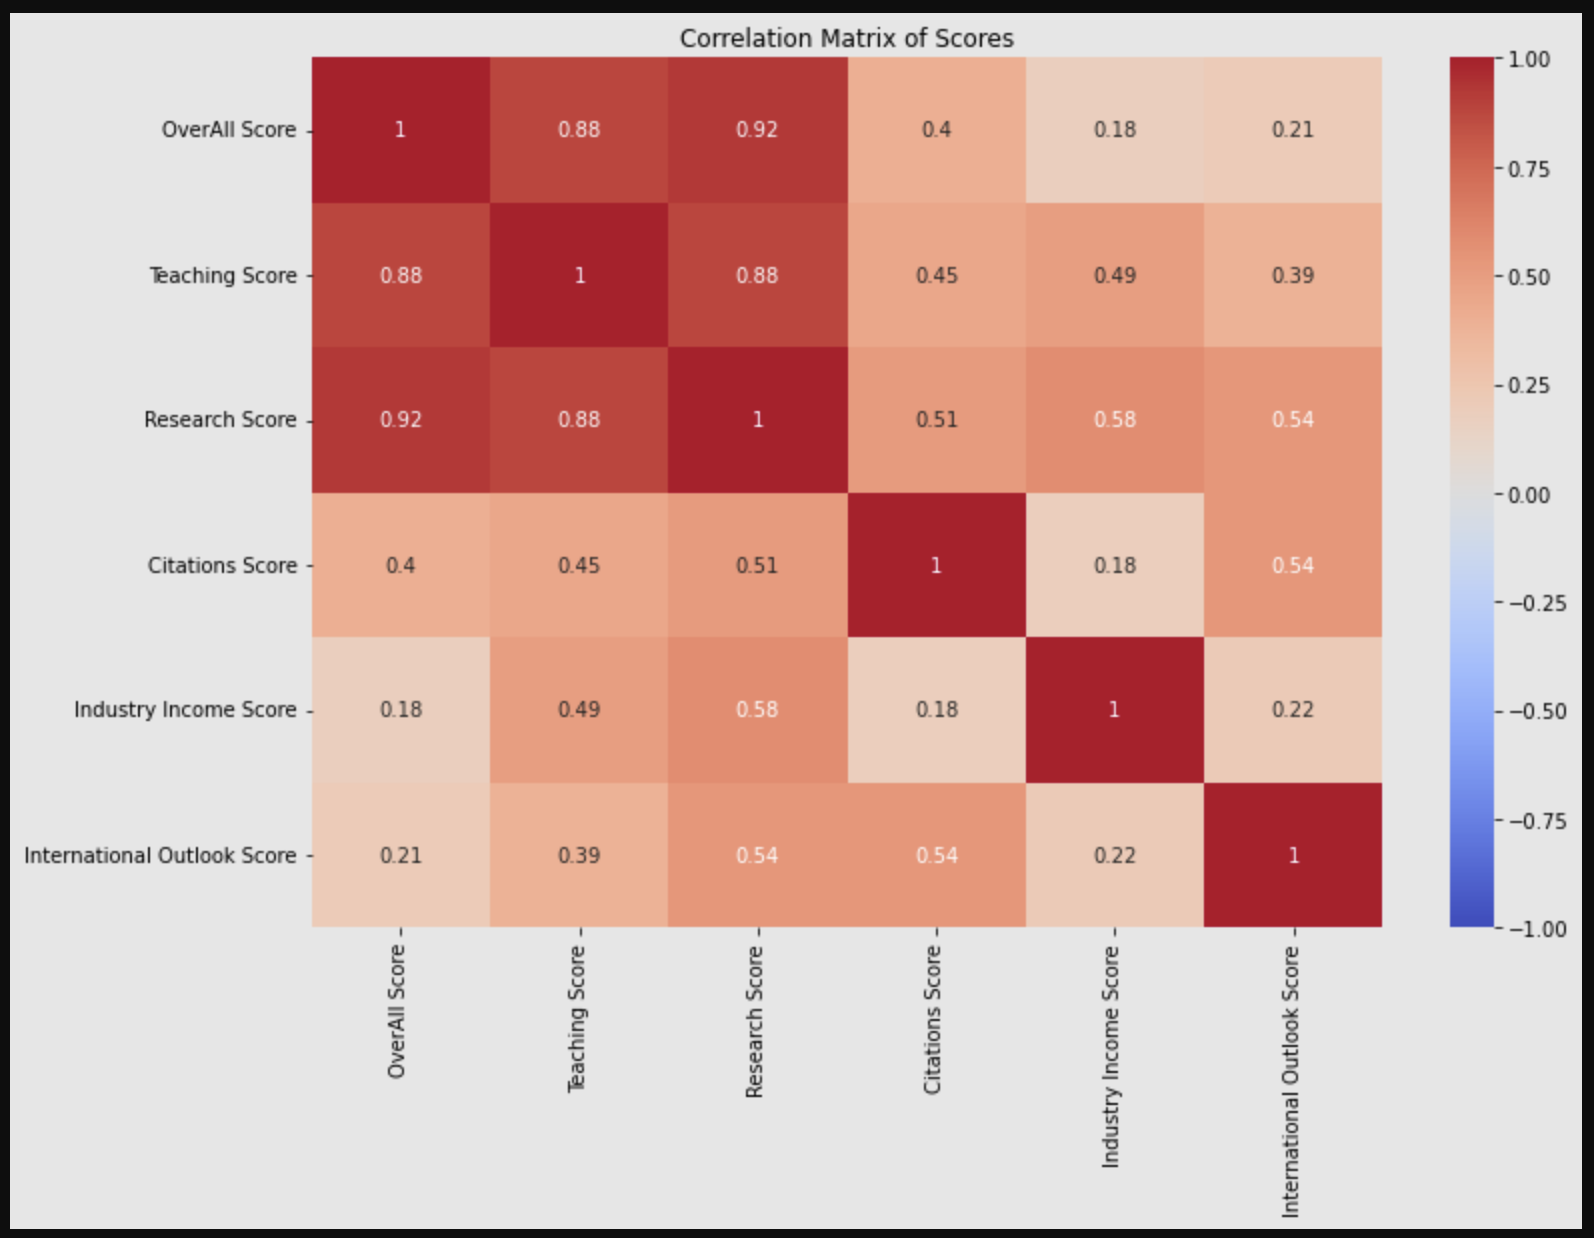
🔍 Insights:
TeachingandResearch? They’re best pals withOverAll Score.CitationsandIndustry Income? Let’s just say they don’t get along very well.Industry Income Scoreis the rebel, choosing its own path.
💭 In Conclusion:
Embark on a journey with this analysis, and you’ll uncover the hidden facets of university performance metrics. Whether you’re a policymaker, university bigwig, or an educational enthusiast, there’s something here for you. Dive in!